Indian Monsoon ,El Niño & La Niña | UPSC Complete Guide 2026
UPSC Comprehensive Guide · GS Paper I + III · Geography & Environment
- भारतीय मानसून
- El Niño · La Niña · ENSO
The rain that feeds a billion people — understand its science, disruptions, and policy dimensions for Prelims & Mains
Prelims 2025GS I – GeographyGS III – EnvironmentENSO MechanismIndia ImpactMains Model Answer
Syllabus Map →GS I: Salient features of World’s Physical GeographyGS I: Distribution of key natural resourcesGS III: Disaster ManagementGS III: Conservation, Environment
Section 01 — OverviewMonsoon – IMD – India Meteorological Department. http://Monsoon – IMD – India Meteorological Department IMD https://mausam.imd.gov.in › imd_latest › contents › mo…
What is the Indian Monsoon?
The word monsoon is derived from the Arabic word mausim, meaning season. The Indian Monsoon is a large-scale seasonal reversal of winds driven by the differential heating of land and sea. It is one of the most powerful and consequential climate systems on Earth, directly governing the livelihoods of over 1.3 billion people in South Asia.
India receives approximately
75–80% of its annual rainfall from the South-West (SW) Monsoon alone, making it the lifeline of Indian agriculture, water resources, and the broader economy. The monsoon is not merely a weather event — it is a civilisational phenomenon.
UPSC Relevance:
Monsoon questions appear almost every year in Prelims (MCQs on dates, rainfall distribution, anomalies) and regularly in Mains (GS I: 10-mark descriptive, GS III: disaster and agriculture links). The ENSO-Monsoon connection is a recurring favourite.
- Interview Guidance Program
- Types of Monsoons in India
- South-West Monsoon (June–Sept):
Brings 75–80% of annual rain. Originates from the Indian Ocean, Arabian Sea, and Bay of Bengal.
North-East Monsoon (Oct–Dec):
Affects south-eastern India (Tamil Nadu, Andhra coast). Caused by retreating winds picking up moisture from Bay of Bengal.
- ASSURED PRELIMS PROGRAMME – UPPCS 2026
- Section 02 — Mechanism
How Does the Monsoon Work?
The monsoon is fundamentally driven by differential heating between the land mass of the Indian subcontinent and the surrounding ocean. By late May–early June, the Thar Desert and the Indian plains heat up intensely, creating a powerful low-pressure zone. Cool, moisture-laden air from the Indian Ocean rushes in to fill this vacuum — this is the onset of the South-West Monsoon.
- SW Monsoon Onset Mechanism
- ☀️ Land heats rapidly
- (May–June)
- →
- 🔴 Low pressure over
- Indian subcontinent
- →
- 🌊 High pressure over
- Indian Ocean
- →
- 💨 Moist winds rush from sea to land
- →
- 🌧️ Rainfall over
- South Asia
- Key Factors Governing the Monsoon
- Inter-Tropical Convergence Zone (ITCZ):
The ITCZ is a belt of low pressure near the equator where trade winds from the Northern and Southern hemispheres converge. During summer, it shifts northward over the Indian subcontinent, drawing in oceanic moisture — this northward shift is the primary engine of the SW Monsoon.
The Tibetan Plateau as a Heat Engine:
The high-altitude Tibetan Plateau heats up during summer, acting as an elevated heat source. This creates upper-level anticyclonic conditions that strengthen the southwesterly flow at the surface. The plateau plays a critical role — without it, the Indian monsoon would be far weaker.
Somali Jet Stream:
A cross-equatorial low-level jet stream, known as the Somali Jet, funnels intense moisture from the eastern African coast across the Arabian Sea into India. It is one of the most powerful boundary-layer jets in the world and is crucial for the Arabian Sea branch of the SW Monsoon.
Western Disturbances:
These are extra-tropical cyclones originating in the Mediterranean Sea. They bring winter rainfall to North-West India (Punjab, Haryana, Himachal Pradesh) and are critical for rabi crop irrigation and snowfall in the Himalayas.
- Branches of the SW Monsoon
- Feature
- Arabian Sea Branch
- Bay of Bengal Branch
- Origin
- Arabian Sea
- Bay of Bengal
- Direction
- South-West to North-East
- South to North
- First landfall
- Kerala coast (~June 1)
- Myanmar, Bangladesh coast
- Areas covered
- Western Ghats, Gujarat, Rajasthan, Punjab
- North-East India, Ganga plains, UP, Bihar
- Moisture content
- Higher (longer sea travel)
- Moderate
- Orographic effect
- Western Ghats cause heavy rainfall on windward side
- Meghalaya hills cause Cherrapunji rains
- Section 03 — Calendar
- Monsoon Calendar: Onset to Withdrawal
- JUN
- 1
- Onset: Kerala
Normal onset date is June 1 over Kerala. IMD announces monsoon onset based on rainfall over 14 stations, OLR values, and wind fields. Kerala onset has significant forecast value for the rest of India.
- JUN
- 10
- Reaches Goa, Karnataka, Mumbai
Both branches now active. Western Ghats receive very heavy rainfall. Maharashtra and Karnataka enter full monsoon season.
- JUL
- 1
- Covers entire India except NW
By July 1, most of India except Rajasthan and parts of Gujarat is covered. The monsoon trough (axis) establishes over the Indo-Gangetic Plain.
- JUL
- 15
- Covers entire country
Entire India, including Rajasthan, is covered by July 15. This marks the peak phase of the monsoon.
- SEP
- 17
- Withdrawal begins: North-West India
Monsoon starts withdrawing from the north-western states. High pressure builds over the Thar Desert area.
- OCT
- 15
- Complete Withdrawal from most of India
SW Monsoon withdraws completely. Post-monsoon (NE Monsoon) becomes active over south-eastern India (Tamil Nadu coast gets heavy rains Oct–Dec).
- ⚡ Prelims Quick-Fact Capsule — Monsoon Calendar
- Kerala onset: June 1 (normal date)
- Mumbai onset: ~June 10
- Delhi onset: ~June 27
- Full country: ~July 15
- Withdrawal starts: Sept 17
- NE Monsoon: Oct–Dec (Tamil Nadu)
- Highest rainfall: Mawsynram (not Cherrapunji) — world record
- Least rainfall: Leh, Jaisalmer
- Break monsoon: period of no/weak rain during active phase
- Monsoon Trough: axis of low pressure along IGP
- Section 04 — ENSO
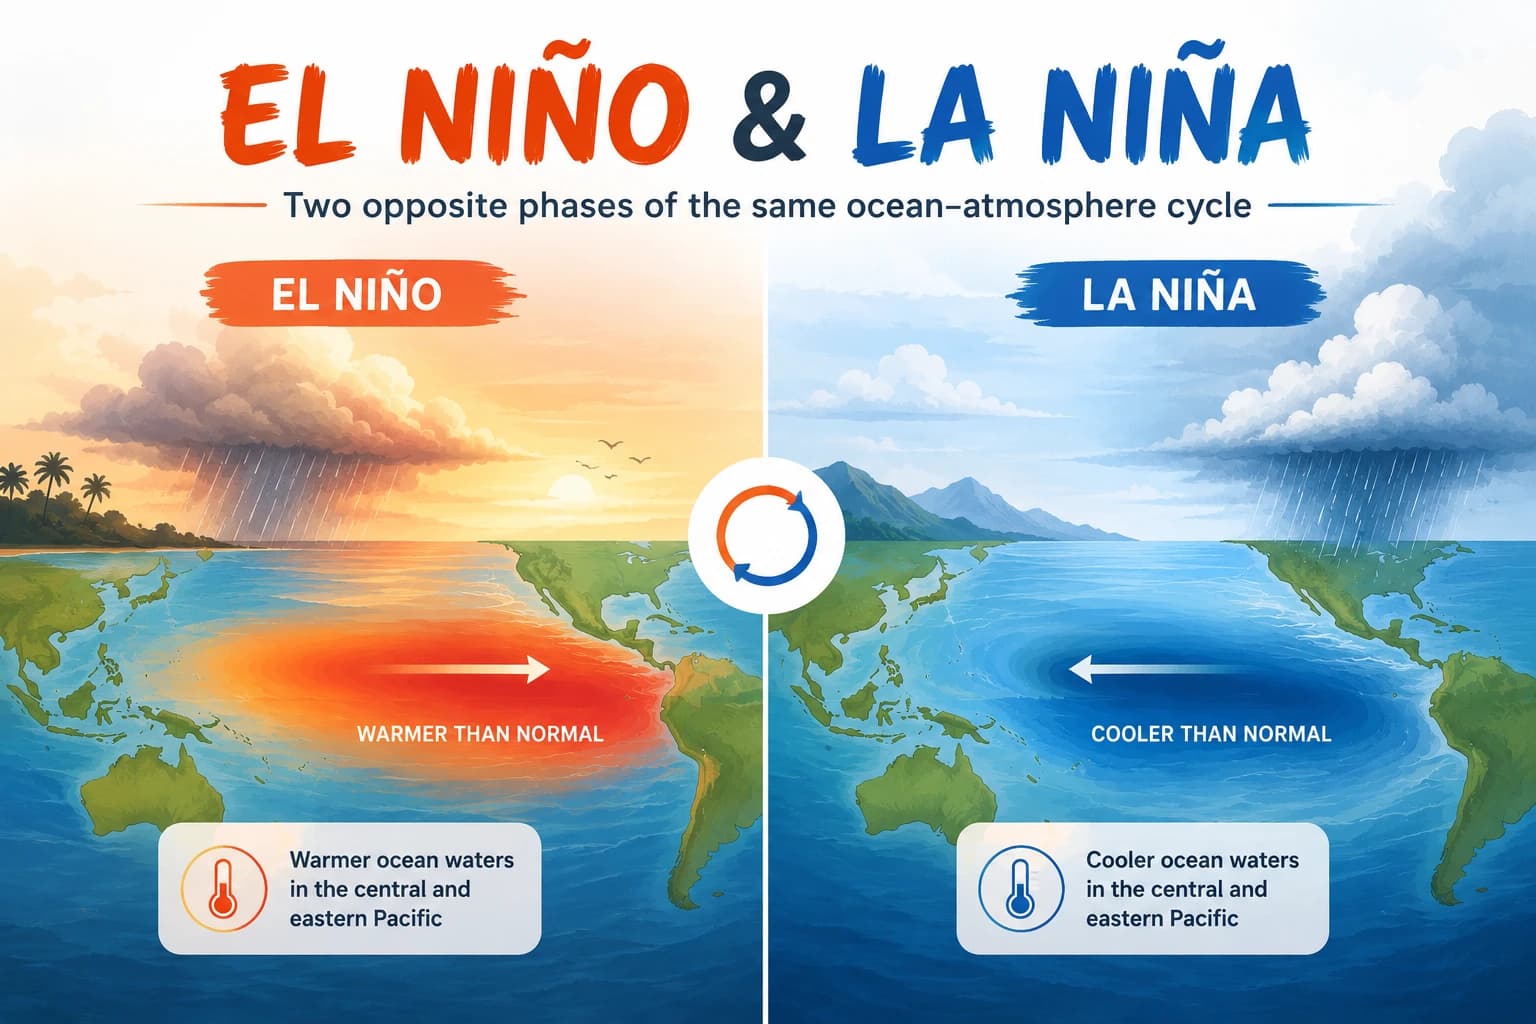
- ENSO: El Niño–Southern Oscillation
ENSO (El Niño–Southern Oscillation) is the most powerful year-to-year climate fluctuation on Earth. It originates in the tropical Pacific Ocean but has global teleconnections that influence rainfall, temperature, and extreme weather events across the world — including India’s monsoon.
- ENSO has three phases:
- 🔥
- Warm Phase
- El Niño
- Unusual warming of central & eastern Pacific Ocean
- Trade winds weaken or reverse
- Warm water pool shifts eastward
- Suppresses Indian Ocean convection
- Associated with below-normal monsoon over India
- Causes droughts in Australia, India; floods in Peru
- Typically lasts 9–12 months
- Occurs every 3–7 years
- 🌊
- Cool Phase
- La Niña
- Unusual cooling of central & eastern Pacific Ocean
- Trade winds strengthen
- Warm water pool pushed further west
- Enhances convection over Indian Ocean
- Associated with above-normal monsoon over India
- Causes floods in India, Australia; droughts in Americas
- Can last 12–36 months (multi-year events possible)
- Often follows El Niño years
- ⚖️
- Neutral Phase
- ENSO Neutral
When neither El Niño nor La Niña conditions are present. Pacific Ocean SSTs are near average. Indian monsoon tends to behave normally, though other factors (IOD, MJO) can still cause variability.
- Section 05 — El Niño Deep Dive
- El Niño: The Christ Child of Climate Disruption
- The name
- El Niño
(Spanish for “The Christ Child” or “The Boy”) was coined by Peruvian fishermen who noticed warm waters appearing along the coast around Christmas, devastating fish catches. Today, it refers to the large-scale warming of the central and eastern tropical Pacific Ocean that occurs every 3–7 years.
- Mechanism of El Niño
- El Niño Formation — Pacific Ocean Dynamics
- 🌊 Trade winds weaken
- (easterlies slacken)
- →
- 🔥 Warm water from West Pacific shifts East
- →
- 🌡️ SST rises in central/eastern Pacific
- →
- ⬆️ Convection & rainfall shift to Pacific
- →
- ☁️ Indian Ocean convection suppressed
- →
- 🌵 Weak/deficient
- Indian Monsoon
- Southern Oscillation & Walker Circulation
The Southern Oscillation is the atmospheric component of ENSO. It refers to the sea-level pressure difference between the eastern Pacific (Darwin, Australia) and the western Pacific (Tahiti). This is measured by the Southern Oscillation Index (SOI).
- Positive SOI
- → La Niña conditions → stronger trade winds → good Indian monsoon
- Negative SOI
- → El Niño conditions → weaker trade winds → deficit Indian monsoon
The Walker Circulation is a zonal (east-west) overturning circulation in the tropical atmosphere. In normal years, air rises over the warm western Pacific, flows eastward at high altitude, sinks over the cool eastern Pacific, and returns westward at the surface as trade winds. El Niño disrupts this circulation.
- El Niño Impact on India
- Sector
- Impact of El Niño Year
- Monsoon Rainfall
Deficit rainfall (below normal): most El Niño years show below-normal monsoon. However, not all El Niño years cause drought — the relationship is probabilistic, not deterministic.
Agriculture
Lower kharif crop production (rice, pulses, oilseeds), particularly in rain-fed areas of Maharashtra, Karnataka, MP, Rajasthan. Can trigger food inflation.
Reservoir Levels
Below-normal rainfall reduces reservoir storage, impacting Rabi crop irrigation and drinking water supply.
Hydropower
Reduced river flows impact hydroelectric power generation, worsening energy shortages.
GDP
Studies show strong El Niño events can reduce India’s agricultural GDP growth by 2–3%; overall GDP impact of 0.5–1% in severe drought years.
Heat Waves
El Niño years are associated with higher temperatures and increased frequency of heat waves over India.
North-East Monsoon
El Niño can enhance the NE Monsoon, bringing above-normal rainfall to Tamil Nadu and Andhra coast.
- ⚡ Historical El Niño Events — India Impact
- 1877 El Niño → Great Famine of India; ~6 million deaths
- 1987 El Niño → Severe drought; 19% below normal rainfall
1997–98 El Niño → Super El Niño; India had near-normal rain due to +IOD offset
- 2002 El Niño → 19% deficit; worst drought in 2 decades
- 2009 El Niño → 23% below normal; severe drought
- 2014–15 El Niño → 12% deficit; moderate drought in India
- 2023–24 El Niño → Significant warming; affected India’s monsoon onset
Not all El Niño years = drought (e.g., 1997–98 India had normal rain)
- Section 06 — La Niña Deep Dive
- La Niña: The Cooler Counterpart
- La Niña
(Spanish for “The Girl” or “The Little Girl”) is the opposite phase of El Niño. It is characterised by the unusual cooling of central and eastern tropical Pacific Ocean surface temperatures, typically by 0.5°C or more below average.
- Mechanism of La Niña
- La Niña Formation — Strengthened Pacific Dynamics
- 💨 Trade winds strengthen
- →
- 🌊 Warm water pushed further westward
- →
- ❄️ Eastern Pacific
- SST cools further
- →
- ⬆️ Enhanced convection over western Pacific & IO
- →
- 🌧️ Above-normal
- Indian Monsoon
- La Niña Impact on India
- Sector
- Impact of La Niña Year
- Monsoon Rainfall
Above-normal rainfall; La Niña years generally see excess monsoon. Can cause widespread flooding.
Floods
Major floods in peninsular India, Assam, Bihar, UP. Risk of displacement and crop damage from excess water.
Agriculture
Generally positive for kharif crops if flooding is moderate. Severe flooding can damage standing crops.
Cyclones
La Niña years see more frequent and intense cyclones in the Bay of Bengal, posing greater threat to eastern coastal states.
Temperature
Cooler conditions globally; India experiences relatively normal to slightly below-normal temperatures.
Multi-year events
La Niña can persist for 2–3 years, cumulatively increasing flood risks in already saturated catchment areas.
- ⚡ Notable La Niña Events — India Impact
- 1975–76 La Niña → Major floods in India and Pakistan
1988 La Niña → 26% above-normal rainfall; devastating floods in Bangladesh
1998–2000 La Niña → Followed super El Niño; above-normal rains
2010–12 La Niña → Multi-year event; contributed to Pakistan’s 2010 mega-floods
- 2020–22 La Niña → Triple-dip event; above-normal monsoon in India
- 2022–23 La Niña → 6% above normal monsoon in India
- Section 07 — Comparison
- El Niño vs La Niña vs Normal Year: Side-by-Side
- Parameter
- Normal Year
- 🔴 El Niño Year
- 🔵 La Niña Year
- Pacific Ocean SST
- Near-average
- +0.5°C or more (warming)
- −0.5°C or more (cooling)
- Trade Winds
- Normal easterly
- Weakened or reversed
- Strengthened
- Warm water pool
- Western Pacific
- Shifts to central/east Pacific
- Pushed further west
- Walker Circulation
- Normal
- Weakened
- Strengthened
- SOI (Southern Oscillation Index)
- Near zero
- Negative
- Positive
- Indian Monsoon
- Normal (96–104%)
- Below normal (drought risk)
- Above normal (flood risk)
- Australia
- Normal
- Drought, fires
- Floods (Queensland)
- South America (Peru)
- Normal
- Heavy rains, floods
- Drought
- North-East India
- Normal
- Deficit rain
- Excess rain, flood risk
- Bay of Bengal Cyclones
- Moderate
- Fewer, weaker
- More frequent, intense
- Global Temperature
- Baseline
- Warmer (global)
- Slightly cooler (global)
- Frequency
- —
- Every 3–7 years
- Every 3–5 years
- Duration
- —
- 9–12 months typically
- 12–36 months (multi-year possible)
- Section 08 — Other Influencing Factors
- Beyond ENSO: Other Key Drivers of Indian Monsoon Variability
- Indian Ocean Dipole (IOD)
The Indian Ocean Dipole (IOD), also called the Indian Niño, is an oscillation in sea surface temperatures between the western and eastern Indian Ocean. It is measured by the Dipole Mode Index (DMI).
Positive IOD:
Western Indian Ocean warmer than eastern. Enhances rainfall over India and East Africa. Can offset El Niño’s negative impact (as in 1997). East Africa and India benefit; Indonesia, Australia face drought.
Negative IOD:
Eastern Indian Ocean warmer. Reduces Indian monsoon rainfall. Can compound La Niña effects.
Key UPSC Fact:
The 1997 super El Niño did NOT cause drought in India because it was simultaneously offset by a strong Positive IOD. This demonstrates that ENSO alone does not determine Indian monsoon — IOD acts as a crucial modulator.
Madden-Julian Oscillation (MJO)
The MJO is an eastward-propagating pulse of enhanced convection and rainfall that circles the globe in approximately 30–60 days. It operates on intra-seasonal timescales (within a season) and can either enhance or suppress Indian monsoon on a week-to-week basis. When the MJO is active over the Indian Ocean region, it can trigger active monsoon spells; when it is in a suppressed phase, it contributes to monsoon breaks.
Mascarene High
A subtropical high-pressure system over the Mascarene Islands in the southern Indian Ocean. It drives the cross-equatorial flow of moisture into India. A stronger Mascarene High typically enhances the Somali Jet, bringing more moisture to India.
Eurasian Snow Cover
Above-normal winter snow cover over Eurasia can weaken the land-sea temperature contrast, potentially leading to weaker monsoon circulation. The Blanford Hypothesis
(1884) first proposed this inverse relationship between Himalayan snow cover and monsoon intensity.
Pacific Decadal Oscillation (PDO)
A long-term (20–30 year) pattern of Pacific Ocean temperature variability. During its warm phase, El Niño tends to occur more frequently; during the cool phase, La Niña dominates. The PDO modulates the background state on which ENSO events operate, affecting their intensity and their teleconnections with the Indian monsoon.
- Section 09 — Regional Rainfall
- Rainfall Distribution Across India
- Rainfall Zone
- Regions
- Annual Rainfall
- Key Feature
- Heavy Rainfall (>200 cm)
- Western Ghats (windward), Assam, Meghalaya, Andaman & Nicobar
- >200 cm
- Orographic effect; Mawsynram (world’s wettest ~1187 cm)
- Moderate Rainfall (100–200 cm)
- West Bengal, Odisha, Bihar, UP (eastern), Konkan coast
- 100–200 cm
- Both SW branches contribute
- Low Rainfall (50–100 cm)
- Punjab, Haryana, UP (western), Gujarat, Deccan plateau (leeward)
- 50–100 cm
- Leeward rain shadow; dependent on Western Disturbances
- Very Low Rainfall (<50 cm)
- Rajasthan, Kutch, Ladakh, J&K, parts of Karnataka (Bellary)
- <50 cm
- Desert climate; far from sea tracks
- Rain Shadow Effect:
The Western Ghats block moisture from the Arabian Sea branch, causing heavy rainfall on the western windward side (Konkan coast, Kerala) and creating a rain shadow on the eastern leeward side (Deccan plateau). Pune gets ~700 mm while Mahabaleshwar (windward) gets ~6,000 mm.
- Section 10 — Contemporary Dimensions
- Climate Change & the Future of Indian Monsoon
Climate change is increasingly influencing monsoon dynamics in complex and often contradictory ways. The IPCC Sixth Assessment Report (AR6, 2021) highlights several key trends:
More intense but erratic rainfall:
While total monsoon rainfall may not decline drastically, extreme rainfall events (heavy rain concentrated in fewer days) are increasing, causing flash floods while overall wet days decrease.
Delayed onset and early withdrawal:
Erratic monsoon calendars are disrupting agricultural planning cycles.
Increased ENSO frequency:
Climate models suggest El Niño events may become more frequent and intense under warming scenarios, increasing drought risk for India.
Weakening monsoon circulation:
Ocean warming may reduce the land-sea temperature contrast, potentially weakening monsoon circulation strength.
Arctic amplification:
Faster warming of the Arctic relative to the tropics may disrupt jet streams, with downstream effects on South Asian monsoon patterns.
The Coupled Model Intercomparison Project (CMIP6) models broadly project an increase in mean South Asian monsoon precipitation under high-emission scenarios (SSP3-7.0, SSP5-8.5), but with large inter-model spread and regional variability.
- Section 11 — Mains Practice
- Model Mains Answers
- GS I · 15 Marks · 250 Words
“Discuss the mechanism of the South-West Monsoon in India. How does El Niño disrupt the Indian Monsoon and what are its socio-economic consequences?”
Introduction
The South-West (SW) Monsoon is the dominant rainfall system of India, contributing 75–80% of its annual precipitation. It operates from June to September and is driven by the differential heating of the Indian subcontinent and the surrounding ocean, drawing moisture-laden winds from the Indian Ocean.
Mechanism
By late May, intense heating over the Thar Desert and the Indo-Gangetic Plain creates a powerful low-pressure zone, while high pressure over the Indian Ocean drives moist winds inland. The northward shift of the ITCZ (Inter-Tropical Convergence Zone) further reinforces this flow. The monsoon arrives over Kerala around June 1 via two branches — the Arabian Sea branch (Western Ghats, coastal India) and the Bay of Bengal branch (North-East India, Gangetic plains). The Tibetan Plateau acts as an elevated heat engine, while the Somali Jet drives moisture from the Arabian Sea.
El Niño’s Disruption
El Niño — the warming of central and eastern Pacific Ocean — weakens Walker Circulation and suppresses convection over the Indian Ocean. This reduces the moisture flux into India, leading to below-normal monsoon rainfall. Historically, major droughts (1987, 2002, 2009) have coincided with El Niño events. The Southern Oscillation Index (SOI) turns negative during El Niño.
Socio-Economic Consequences
Deficient monsoon reduces kharif output (rice, pulses, oilseeds), triggers food inflation, strains rural employment, and lowers rural purchasing power. Reservoir levels decline, affecting irrigation, hydropower, and drinking water. GDP impact can reach −0.5 to −1% in severe drought years. Heat waves during El Niño years also increase health burdens.
Conclusion
The Indian monsoon is a complex, multi-factor system. While El Niño is a key disruptor, the Indian Ocean Dipole (IOD), MJO, and Eurasian snow cover modulate its influence. Strengthening IMD’s forecasting capabilities and investing in drought-resilient agriculture are critical policy priorities.
GS III · 10 Marks · 150 Words
“How does La Niña differ from El Niño in its impact on the Indian monsoon and disaster risk?”
Core Difference
While El Niño is characterised by anomalous warming of the central/eastern Pacific (weakening trade winds, suppressing Indian monsoon), La Niña is the opposite — cooling of the Pacific with strengthened trade winds that push warm water westward, enhancing convection over the Indian Ocean and driving above-normal monsoon rainfall over India.
Disaster Risk
La Niña years heighten flood risk in India, particularly in Assam, Bihar, UP, Odisha, and AP. Bay of Bengal cyclone frequency increases. Multi-year La Niña events (2010–12, 2020–22) amplify damage as catchment soils remain saturated. Pakistan’s 2010 catastrophic floods were partly attributed to a strong La Niña event. For India’s east coast, increased cyclone intensity demands enhanced NDMA preparedness.
Conclusion
India must develop differentiated climate-smart policies: drought-proofing for El Niño years and flood management infrastructure reinforcement for La Niña years, guided by real-time ENSO monitoring.
- Section 12 — Prelims Practice
- MCQ Practice Set
Q1. Which of the following correctly describes the Southern Oscillation Index (SOI)?
A It measures the sea surface temperature difference between eastern and western Indian Ocean
B It measures the sea-level pressure difference between Tahiti and Darwin
C It is an index of the strength of the Tibetan anticyclone
D It measures the deviation of Indian monsoon from its long-period average
✅ Answer: B | SOI = Pressure difference between Tahiti (eastern Pacific) and Darwin, Australia (western Pacific). Negative SOI = El Niño; Positive SOI = La Niña.
Q2. Consider the following statements about El Niño:
1. El Niño is associated with the warming of the western Pacific Ocean
- 2. All El Niño years necessarily result in drought in India
- 3. El Niño weakens the Walker Circulation
Which of the statements given above is/are correct?
- A 1 and 2 only
- B 2 and 3 only
- C 3 only
- D 1, 2 and 3
✅ Answer: C | Statement 1 is wrong — El Niño warms the CENTRAL and EASTERN Pacific. Statement 2 is wrong — not all El Niño years cause drought (1997 was a super El Niño but India had near-normal rain due to +IOD). Only statement 3 is correct.
Q3. Which of the following is the world’s wettest place (highest average annual rainfall)?
- A Cherrapunji, Meghalaya
- B Mawsynram, Meghalaya
- C Agumbe, Karnataka
- D Mahabaleshwar, Maharashtra
✅ Answer: B | Mawsynram (~1187 cm/year) holds the record for highest average rainfall, surpassing Cherrapunji. Both are in Meghalaya and receive orographic rainfall from Bay of Bengal branch.
Q4. The Indian Ocean Dipole (IOD) can modulate the impact of El Niño on Indian monsoon. A positive IOD is associated with which of the following?
- A Cooler western Indian Ocean and warmer eastern Indian Ocean
- B Warmer western Indian Ocean and cooler eastern Indian Ocean
- C Uniform warming across the entire Indian Ocean
- D Stronger trade winds over the Indian Ocean
✅ Answer: B | Positive IOD = western Indian Ocean warmer than eastern. Enhances rainfall over India and East Africa; drought in Indonesia and Australia. Can offset El Niño’s negative impact on Indian monsoon.
Q5. Which of the following statements about La Niña is/are correct?
1. La Niña is generally associated with above-normal monsoon rainfall in India
2. La Niña events are always shorter than El Niño events
3. La Niña increases the frequency of cyclones in the Bay of Bengal
- Select the correct answer using the code below:
- A 1 only
- B 1 and 2 only
- C 1 and 3 only
- D 1, 2 and 3
✅ Answer: C | Statement 2 is incorrect — La Niña can actually last longer than El Niño. Multi-year La Niña events (lasting 2–3 years) are well-documented (e.g., 2020–22 triple-dip La Niña). Statements 1 and 3 are correct.
- Section 13 — Key Terms
- Glossary of Important Terms
- ENSO
El Niño–Southern Oscillation. Combined oceanic-atmospheric phenomenon in the tropical Pacific; key driver of global climate variability.
SOI (Southern Oscillation Index)
Pressure difference between Tahiti and Darwin. Negative = El Niño; Positive = La Niña.
Walker Circulation
Zonal (east-west) atmospheric circulation over the tropical Pacific, driven by SST gradients. Weakened by El Niño, strengthened by La Niña.
ITCZ
Inter-Tropical Convergence Zone. Low-pressure belt near equator where trade winds meet. Its northward shift drives SW Monsoon onset.
IOD (Indian Ocean Dipole)
Temperature difference between western and eastern Indian Ocean. Positive IOD enhances Indian monsoon; can offset El Niño impact.
MJO (Madden-Julian Oscillation)
Eastward-propagating 30–60 day intraseasonal oscillation of convection. Drives week-to-week active/break monsoon cycles within a season.
Somali Jet
Low-level cross-equatorial jet stream from East Africa into Arabian Sea. Critical moisture carrier for Arabian Sea branch of SW Monsoon.
PDO (Pacific Decadal Oscillation)
Long-term (20–30 year) Pacific temperature pattern. Modulates ENSO frequency and intensity over multi-decadal timescales.
Monsoon Trough
Low-pressure axis that establishes along the Himalayan foothills/IGP during active monsoon. Its position determines regional rainfall distribution.
Orographic Rainfall
Rainfall caused when moist air is forced upward by mountains. Windward side gets heavy rain; leeward side is in rain shadow.
Break Monsoon
Period during the SW Monsoon season when rainfall activity over peninsular India weakens or stops for several days; active over Himalayas and NE India.
Long Period Average (LPA)
The 50-year average of Indian monsoon rainfall (~88 cm for June–September). IMD uses it as baseline; 96–104% = Normal monsoon.
- Section 14 — Legal & Policy Dimensions
- Legal Reasoning & Policy Angles
- ⚖ Legal Reasoning Dimensions
- National Disaster Management Act, 2005:
NDMA mandates preparation of National Disaster Management Plans; ENSO-driven droughts and floods fall under its ambit. Legal accountability of states during drought relief is testable.
Right to Food:
Supreme Court has interpreted Article 21 (Right to Life) to include right to food. El Niño-induced crop failure creates a Constitutional duty of the state to ensure food security — a frequently examined legal reasoning passage.
Inter-State Water Disputes:
Cauvery, Krishna disputes often intensify during El Niño years (deficit rainfall). River Boards Act 1956 and Interstate Water Disputes Act 1956 govern these. CLAT passages often use water wars as legal reasoning scenarios.
Climate Litigation:
India’s National Green Tribunal (NGT) has jurisdiction over environmental cases. Climate-change-induced flood/drought damage can give rise to climate litigation — an emerging area of environmental law.
WTO & Agriculture:
ENSO-driven crop failures affect MSP, procurement, and export bans (e.g., rice export bans in 2023), creating trade law implications under WTO Agreement on Agriculture — relevant for CLAT international law passages
GS Paper I (Geography) · GS Paper III (Environment & Disaster) · Content for educational purposes only